This is a guest blog from James Yorke, who builds websites and offers digital marketing over at Becomeknown.
We now have access to a wide range of data, from what we buy at the shops to the number of friends we have on Facebook. Data is everywhere and it can be overwhelming. On your charity website what is the data that can help you to make informed decisions that improves your campaigns and help you meet your aims?
If you work on a website in some way you have likely come across Google Analytics which is the analytics tool that the vast majority of websites use to record traffic behaviour. You may heard of terms such as bounce rates, pageviews, visits and goals but what do they mean for your digital marketing campaigns and which should you be using?
Choosing What to Measure
Success comes from clarity. To clarify what you are trying to achieve you need to create a digital marketing and measurement plan which will outline details such as your aims, the methods that you will use to achieve them and the ways in which you will measure the performance of the campaign. Common aims for a charity digital marketing campaign would be donations, email newsletter sign-ups and contact via a website.
Digital marketing evangelist, Avinash Kaushik, has put together this wonderful post on how to create such a plan.
Creating this will result in everyone on the team being fully aware of the campaign’s aims and so measuring them in a tool such as Google Analytics will be considerably easier. Here is a guide to what are generally the most important parts of Google Analytics for measuring charity marketing campaigns:
Goals
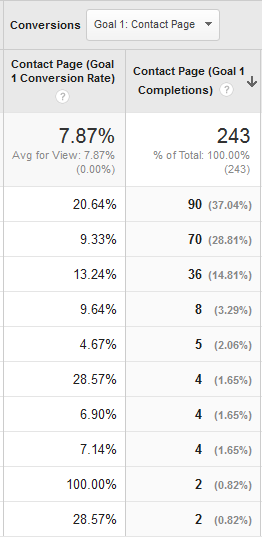
This is a feature where you can specify the website actions that represent the aims of your digital marketing campaign. When someone performs one of these actions it is noted as a “conversion” within Google Analytics data. For example, a charity may look to receive donations via their website and so a conversion would be when someone reaches thank you page after submitting a donation payment.
Goals are possibly the most important part of a Google Analytics set-up as they allow you to evaluate how often, if at all, your website is being used to perform those actions which are critical to your organisation.
Traffic Sources
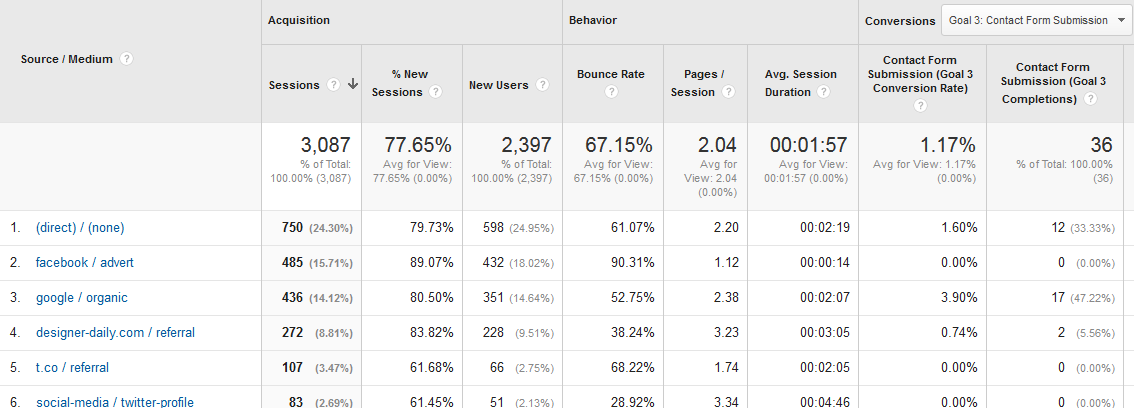
Within this part of Google Analytics (found via “Acquisition” > “All Traffic” > “Source/Medium”), you are able to see a plethora of data relating to the website’s traffic sources (e.g. Google, Facebook, email marketing) such as the number of website visits, how long they spent on the website and how many conversions occurred as a result of a website visit via a specific traffic source.
As a charity, this may provide you with a great insight into how valuable your Facebook traffic is compared to, say, a Google Adwords campaign in terms of traffic and conversions and various other metrics.
Site Content
Another particularly insightful section within Google Analytics is the “Top Content” which can be found within the “Behavior” > “Site Content” > “All Pages” section.
This will show you data relating to specific pages on your website such as how many pageviews they have received, the average time on each page and the bounce rate. Examining this can show you how well pages are working. For example, are people leaving immediately after visiting a certain page or is a specific page proving to be particularly popular with people visiting from LinkedIn?
It is also important to remember that data may initially lead you to think about a page in one particular way but it may not be the full story. For example, people may visit your contact page after entering your charity’s contact details into Google and then may leave immediately. This means that the contact page’s bounce rate will be high but the reason is that it provided the required information.
Sometimes, tracking off-site digital marketing is not quite specific enough and so you need more information on where traffic comes from. For example, your charity may run a Twitter advertising campaign which will include a link back to your website. The Campaigns (found via “Acquisition” > “Campaigns” > “All Campaigns”) feature of Google Analytics can help you to get even more precise information.
Using Google’s URL builder, you can add more information to a URL such as the source of the traffic, medium and a label to help you track in greater detail. Using the Twitter advertising campaign example above, you could use this to track clicks from specific tweets to your donation page which would help you determine which tweets produced more donations.
Custom Dashboards
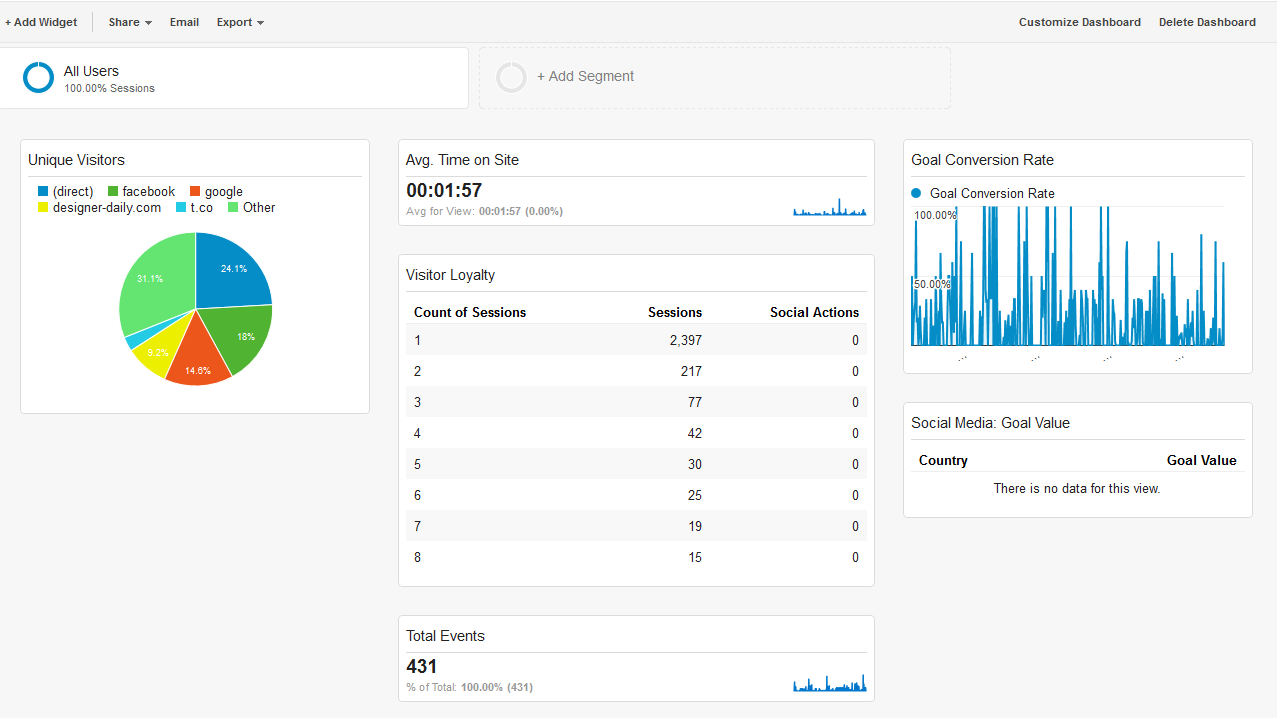
It is likely that there are a number of stakeholders who will require data on how your website is being used and that their requirements will differ. Dashboards allow you to quickly view key metrics and so custom dashboards allow you to tailor this view for different people’s requirements.
For example, senior management within a charity are likely to require high level data such as the number and value of donations while marketing officers will want to see which traffic sources are generating donations and where these people are located.
Summary
Using Google Analytics to effectively monitor a charity’s digital marketing is tough but with a structured process and focus on core metrics it can be made considerably easier. Website analytics are about people and using data to gradually get to know your audience just that little bit better over time so that you can make their experience better can make the difference between a good and great digital marketing campaign.
What do you think are the most important parts of Google Analytics? Let us know via the comments section below!


